MathBox Introduction
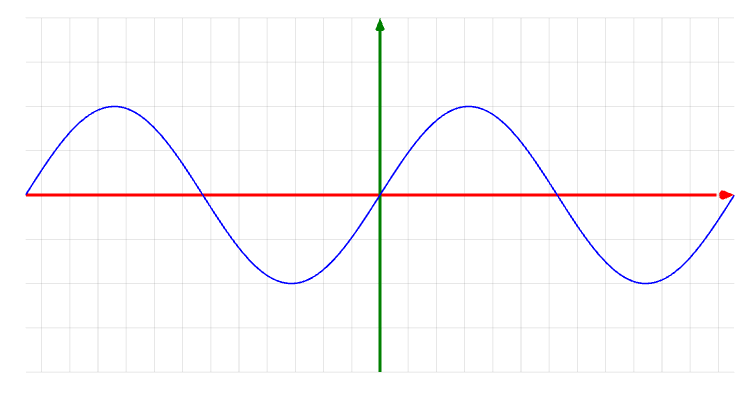
Illustrates how to create a graph of a 2D function y = f(x) in MathBox.
Illustrates how to create a graph of a 2D function y = f(x) in MathBox.
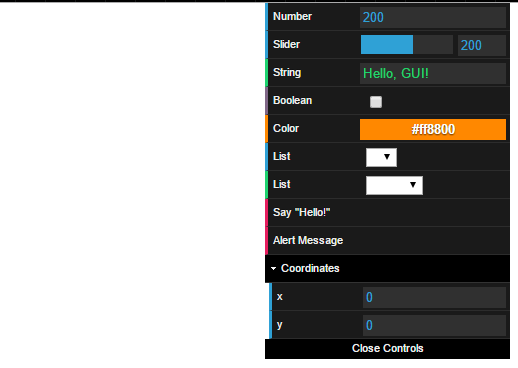
Illustrates how to set up the different data types using dat.gui: numbers, number sliders, text, booleans, colors, lists, functions, and folders.
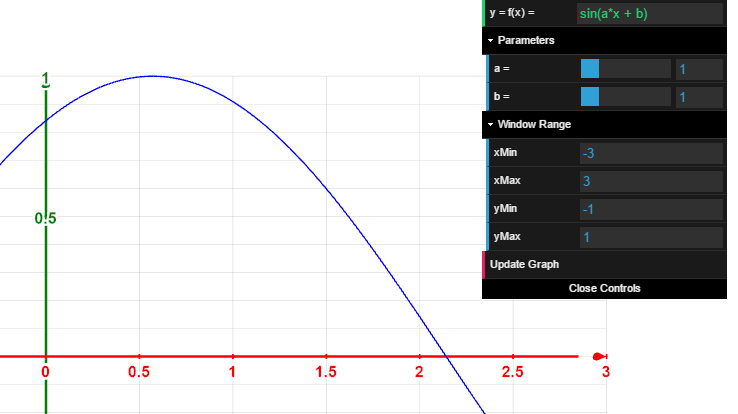
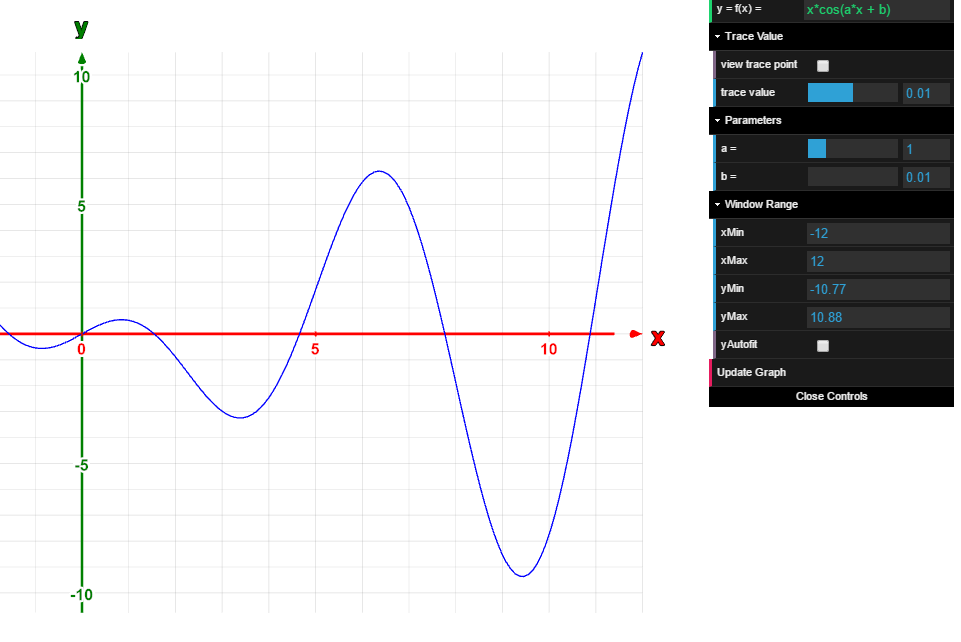
Graph of a 2D function y = f(x). New features:
- integration with dat.gui
- function may be entered via text box; formula parsed via Silent Matt's JavaScript Expression Evaluator
- adjustable parameters a and b can be used in the function definition
- axes contain tick marks and corresponding labels
Graph of a 2D function y = f(x). New features:
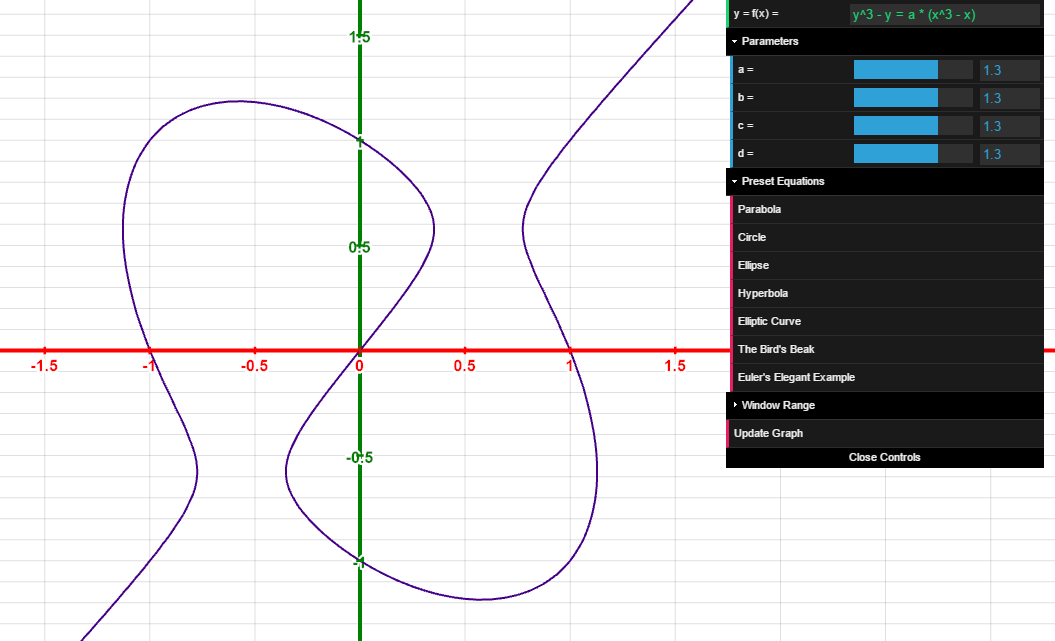
Graph of a 2D curve defined implicitly by f(x,y) = g(x,y). Uses the marching squares algorithm to approximate the curve. Includes a variety of preset equations.
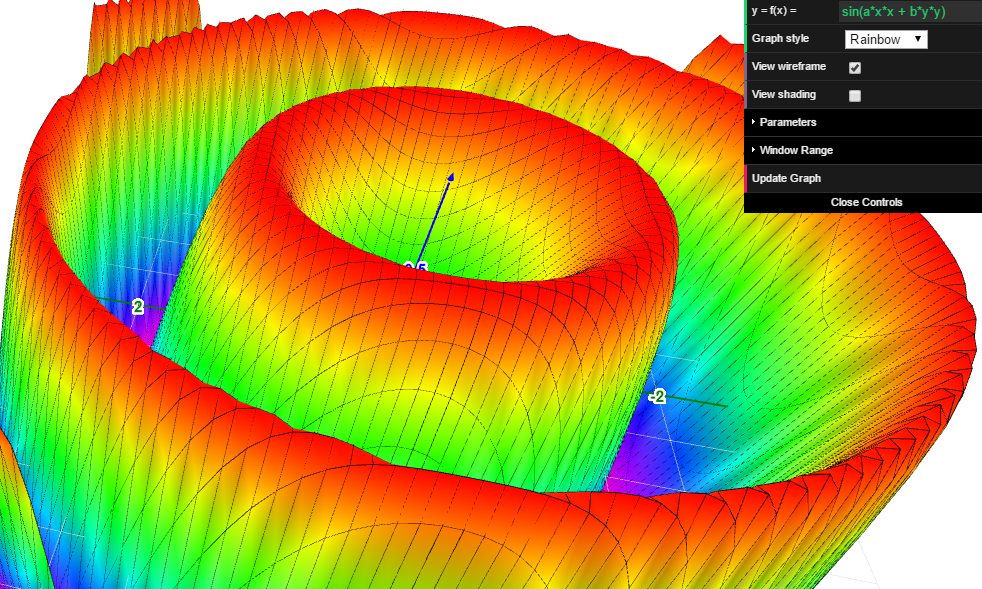
Graph of a 3D function z = f(x, y). Includes adjustable parameters, various color schemes, and optional wireframe and shading.
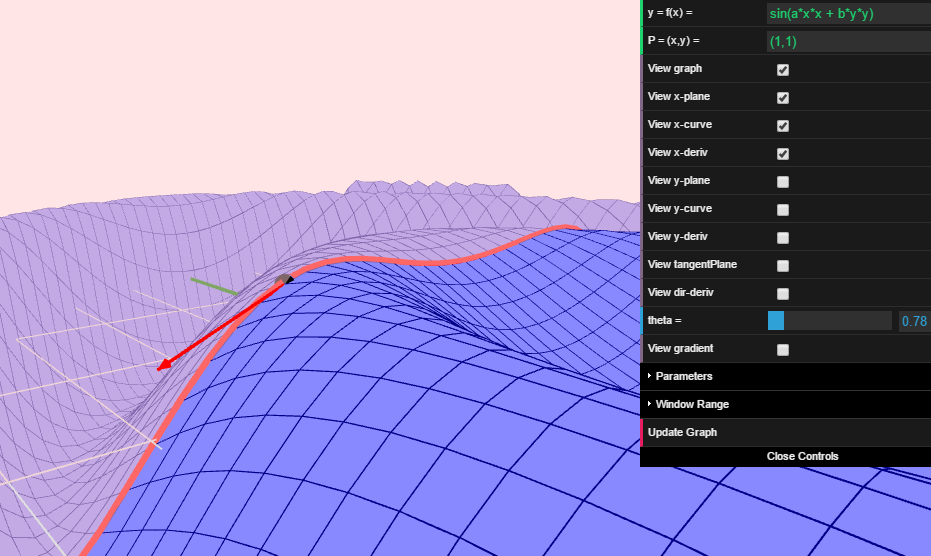
Graph of a 3D function z = f(x,y). Coordinates of a point entered as text. Includes optional graphs of x- and y- partial derivatives, tangent plane, directional derivatives, and the gradient at the given point.
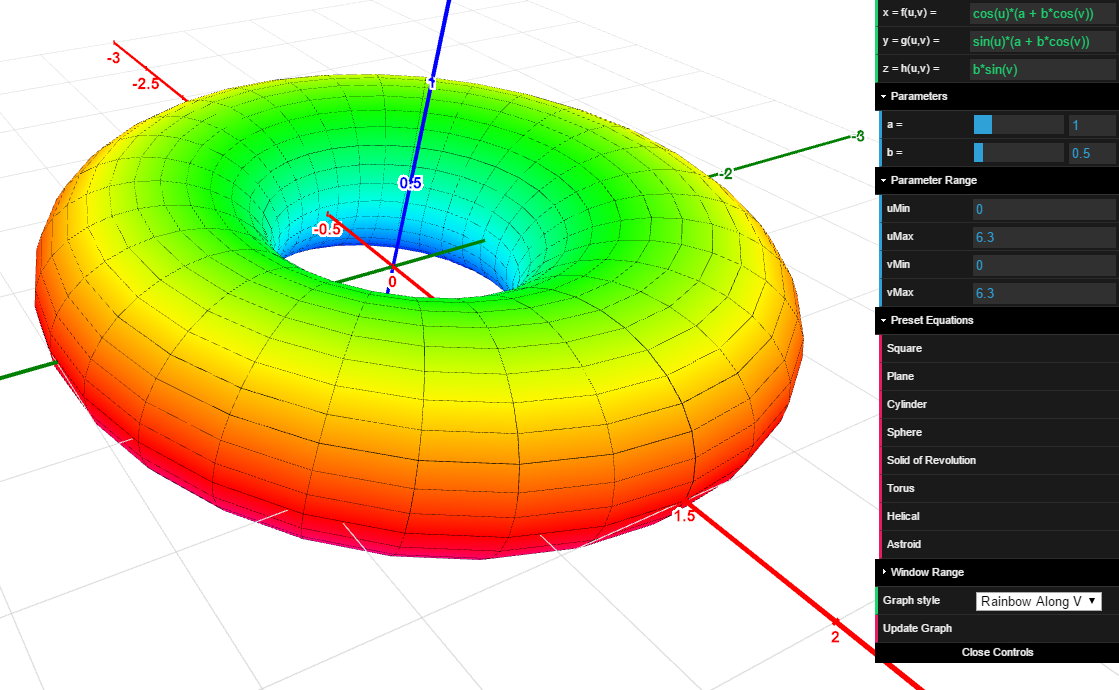
Graph of a 2D surface (x,y,z) = (f(u,v), g(u,v), h(u,v)) in 3D.
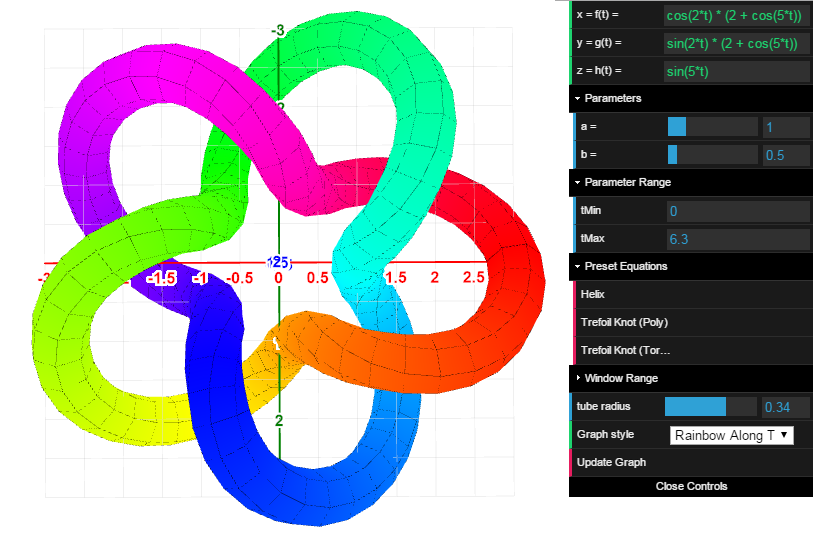
Graph of a curve (x,y,z) = (f(t), g(t), h(t)) in 3D. Plots a variable size/color tube around the curve for easier visibility.